Cryptocurrency & Bitcoin Charts, Analysis and Perdictions
List Of Cryptocurrency & Bitcoin Analysis Platforms Given BelowWhat Are Cryptocurrency Charts?
Cryptocurrency charts are graphical representations of the price movements of a particular cryptocurrency over a given period of time. They are used to track the performance of a cryptocurrency and to identify trends and patterns in the market. Charts can be used to identify support and resistance levels, as well as to identify possible entry and exit points. Types of cryptocurrency charts include candlestick, bar and line charts, as well as dozens of indicators that can be overlaid to provide additional insight.
Crypto Charts Historical Performance ?
Crypto Charts Historical Performance provides a detailed overview of historical performance data on the various crypto currencies. The charts on the site show the open, high, low and close prices for the different cryptos over the specified period of time. In addition, the charts also show the performance of crypto investments against various crypto assets including Bitcoin, Ethereum, USDT and more. The charts also feature technical analysis and various indicators to help in making informed decisions.
 TradingView
 Coinmarketcap
 Investing.com
 Cryptocompare
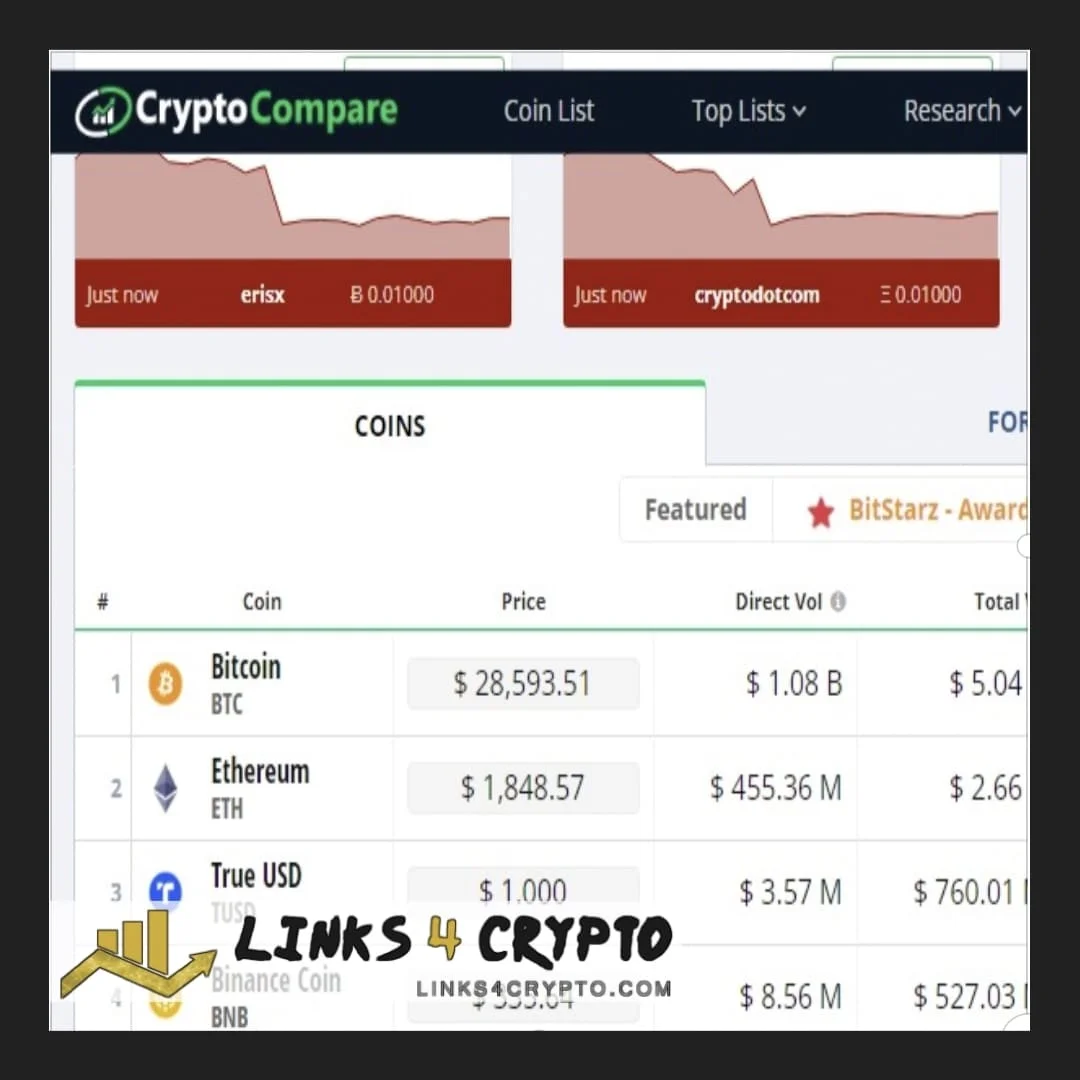
 CryptoWatch
 Crypto ID
 Trade Block
 Bitcoin Average
 CoinMetrics
Different coin prices are given below.
Different cities times are given below.
If you are a beginner in crypto or a pro in crypto. You must know what https://t.co/apQXxh6uXH website is and must bookmark it in your browser. This is a helpful website for all crypto investors and traders.#L4C #Bitcoin #Crypto #Cryptocurrency #Trading #CryptoNews #investing pic.twitter.com/4nnR4ZJ3Xf
— Links4Crypto.com (@links4crypto) July 23, 2023