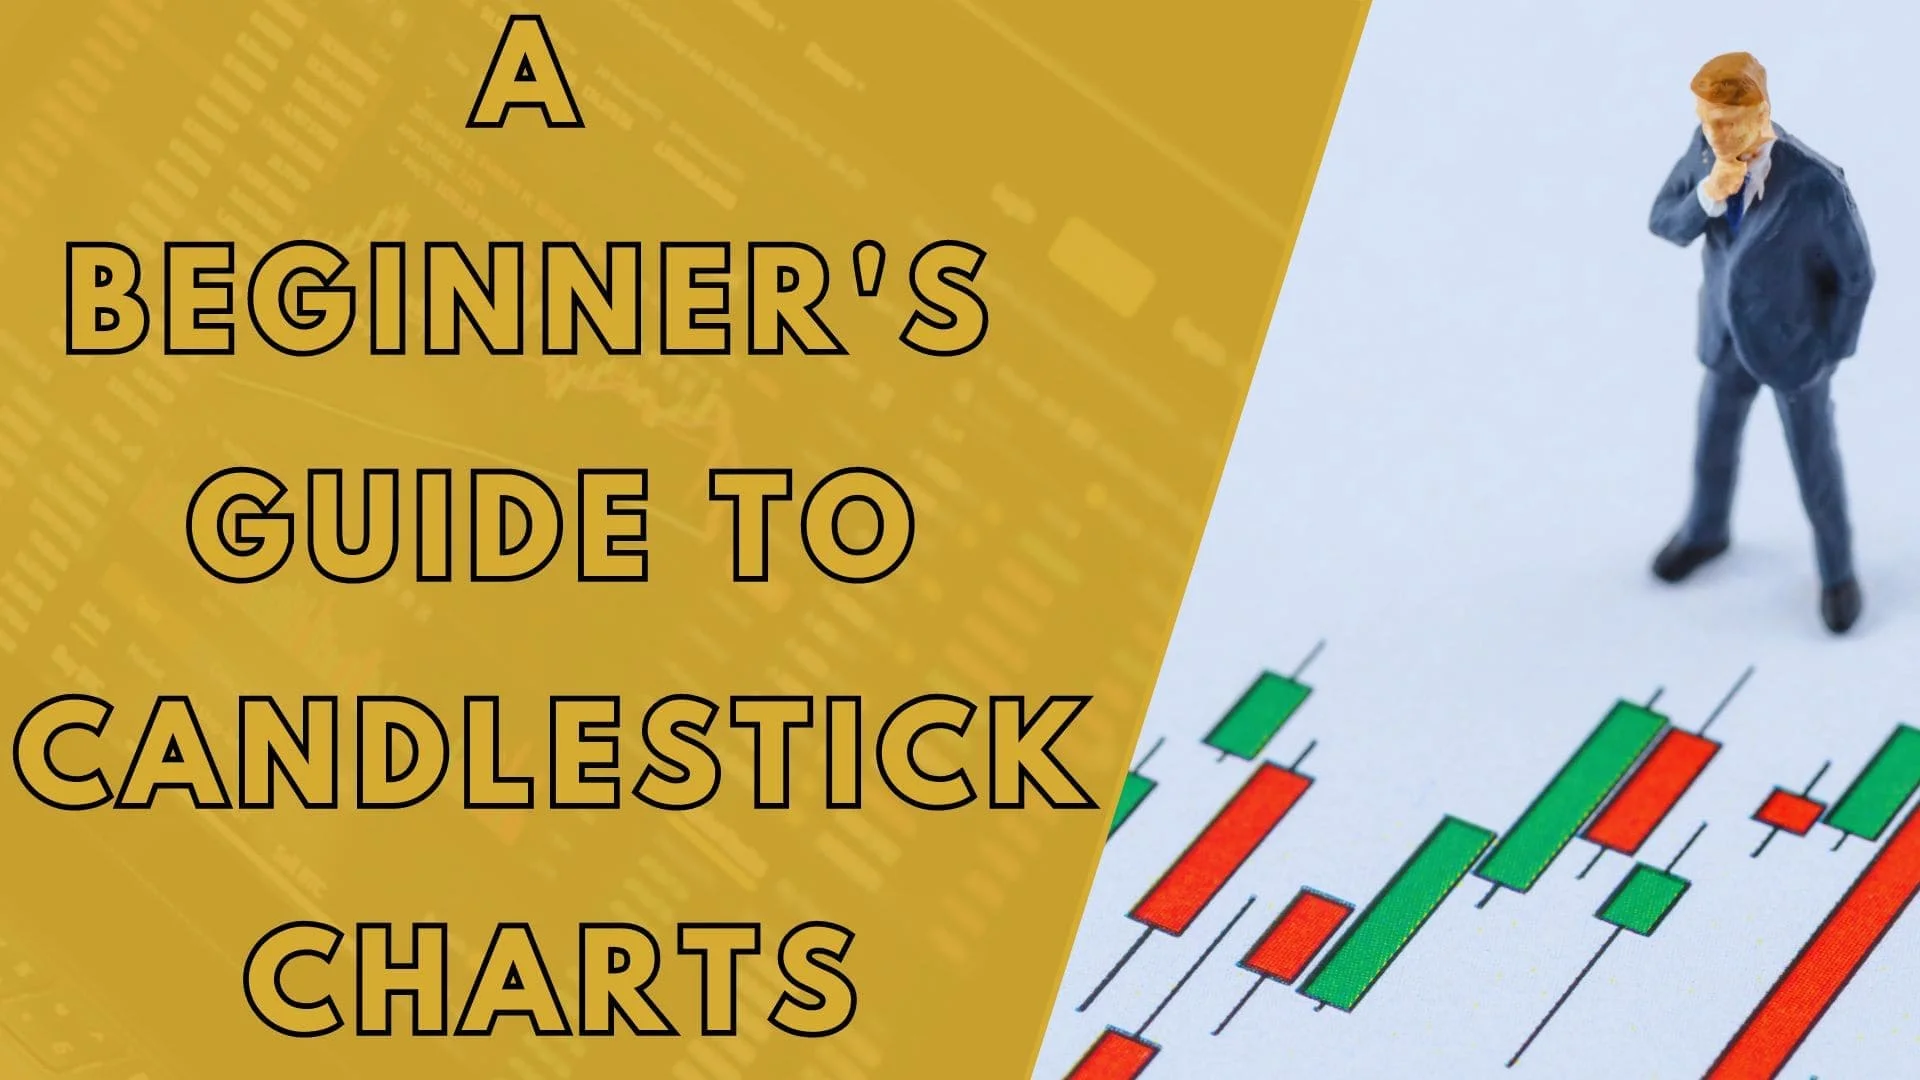
A Beginner's Guide to Candlestick Charts
Candlestick charts are a popular tool used in technical analysis to visualize price movements of financial assets, such as stocks, currencies, and commodities. They provide valuable insights into market sentiment and help traders make informed decisions. If you're new to trading or technical analysis, understanding candlestick charts is a fundamental step towards mastering the art of trading. In this beginner's guide, we'll explore what candlestick charts are, how they work, and how you can interpret them effectively.

Posted on 25 Aug 2023
What are Candlestick Charts?
Candlestick charts originated in Japan in the 18th century and were used to track the price movements of rice. Today, they are widely used by traders and investors across various financial markets. Candlestick charts visually represent price movements over a specific time period, displaying four key data points: open, high, low, and close prices.
Anatomy of a Candlestick
A single candlestick consists of a rectangular body and two wicks, also known as shadows, protruding from the top and bottom of the body. The body represents the price range between the open and close prices for the given time period. If the closing price is higher than the opening price, the body is typically filled or colored, indicating bullishness. Conversely, if the closing price is lower than the opening price, the body is often left empty or shaded, suggesting bearishness.
Bullish and Bearish Candlesticks
- Bullish Candlesticks: Bullish candlesticks signal upward price momentum. They occur when the closing price is higher than the opening price. Examples of bullish candlestick patterns include the "hammer," "bullish engulfing," and "morning star."
- Bearish Candlesticks: Bearish candlesticks indicate downward price momentum. They form when the closing price is lower than the opening price. Common bearish candlestick patterns include the "hanging man," "bearish engulfing," and "evening star."
Common Candlestick Patterns
Recognizing common candlestick patterns is essential for traders to identify potential trend reversals or continuations. Some widely observed patterns include:
- Doji: A doji occurs when the opening and closing prices are virtually the same, resulting in a small-bodied candlestick with long wicks. It suggests indecision in the market.
- Harami: The harami pattern consists of two candlesticks, where the second candlestick is smaller and is completely engulfed by the previous candlestick. It indicates a potential reversal of the prevailing trend.
- Marubozu: Marubozu candlesticks have long bodies with little to no wicks, suggesting strong buying or selling pressure depending on whether they are bullish or bearish.
Interpreting Candlestick Charts
Interpreting candlestick charts involves analyzing individual candlesticks and patterns within the broader context of market trends, support and resistance levels, and other technical indicators. Traders often use candlestick patterns in conjunction with other forms of technical analysis to make well-informed trading decisions.
Conclusion:
Candlestick charts are a powerful tool for traders to analyze price movements and identify potential trading opportunities. While this beginner's guide provides a basic understanding of candlestick charts, mastering their interpretation requires practice and experience. By studying various candlestick patterns and observing how they correlate with market movements, traders can gain valuable insights into market sentiment and improve their trading strategies. As with any form of analysis, it's essential to combine candlestick patterns with other technical indicators and risk management techniques for successful trading outcomes.


