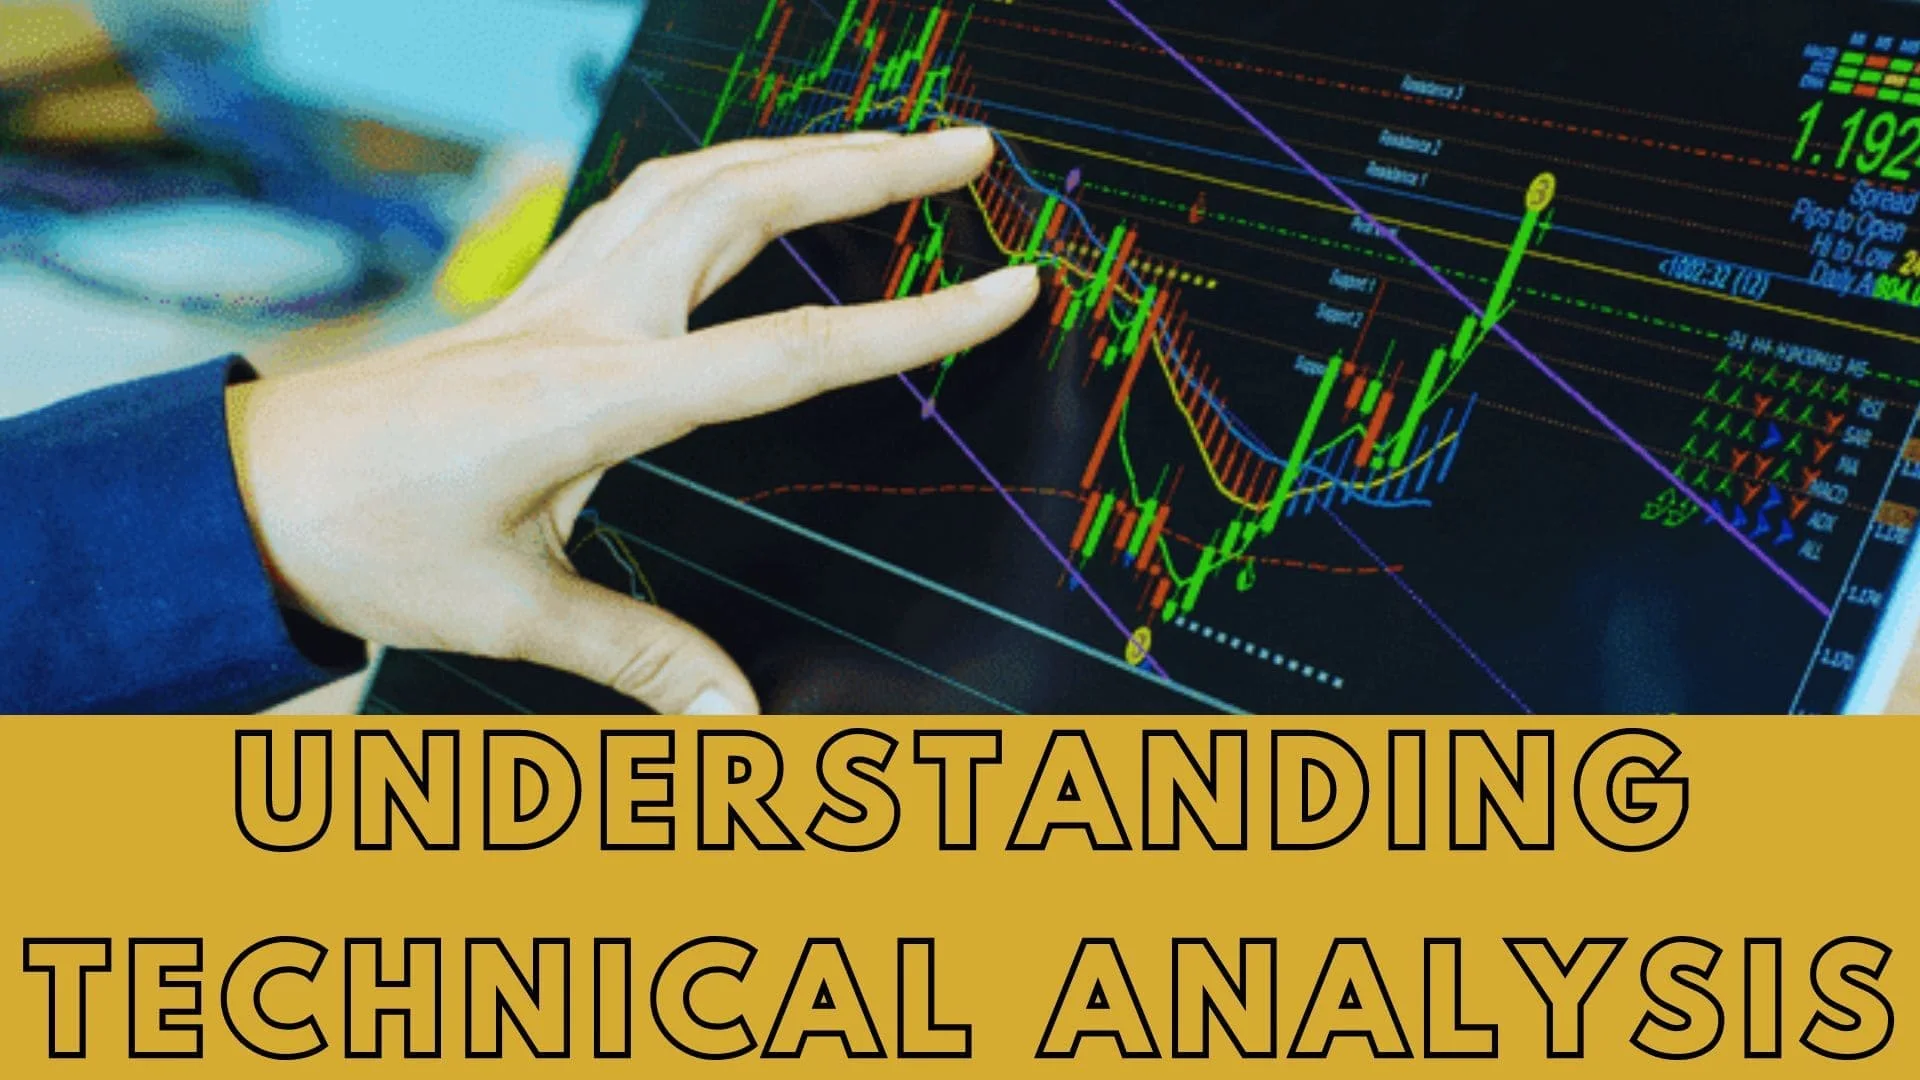
Understanding Technical Analysis: A Comprehensive Guide
Technical analysis is a method used by traders and investors to forecast the future direction of financial markets, such as stocks, currencies, commodities, and cryptocurrencies. Unlike fundamental analysis, which focuses on examining the intrinsic value of an asset based on economic, financial, and qualitative factors, technical analysis primarily relies on historical price and volume data to make predictions. In this article, we'll delve into the principles, tools, and strategies of technical analysis.

Posted on 17 Aug 2023
Principles of Technical Analysis
Technical analysis is based on several key principles:
- Market Discounts Everything: This principle suggests that all information, whether it be fundamental factors, market sentiment, or external events, is already reflected in an asset's price. Therefore, the analysis of price movements is paramount.
- Price Moves in Trends: Technical analysts believe that prices tend to move in trends, whether upward, downward, or sideways. Identifying and following these trends is essential for making trading decisions.
- History Tends to Repeat Itself: Technical analysts argue that market participants tend to exhibit similar behavior in similar situations, leading to repetitive patterns in price movements. By recognizing these patterns, analysts attempt to predict future price movements.
Tools of Technical Analysis
Several tools and techniques are commonly used in technical analysis:
- Charts: Charts are graphical representations of price movements over a specific period. The most common types of charts include line charts, bar charts, and candlestick charts. Candlestick charts are particularly popular among technical analysts due to their ability to convey a wealth of information in a single bar.
- Indicators: Technical indicators are mathematical calculations based on price and volume data. They help traders identify trends, momentum, volatility, and potential reversal points in the market. Examples of popular indicators include moving averages, relative strength index (RSI), stochastic oscillator, and MACD (Moving Average Convergence Divergence).
- Support and Resistance Levels: Support levels represent areas where buying interest is expected to be strong enough to prevent the price from declining further, while resistance levels represent areas where selling interest is expected to be strong enough to prevent the price from rising further. Identifying these levels is crucial for determining entry and exit points.
Strategies of Technical Analysis
Various trading strategies are employed by technical analysts to capitalize on price movements:
- Trend Following: This strategy involves identifying and trading in the direction of established trends. Traders may use moving averages or trendlines to determine the trend's direction and enter positions accordingly.
- Reversal Trading: Reversal traders aim to identify potential trend reversals by spotting signs of exhaustion in the prevailing trend. Common reversal patterns include head and shoulders, double tops/bottoms, and bullish/bearish divergences between price and indicators.
- Breakout Trading: Breakout traders look for instances where prices break through significant support or resistance levels, signaling the potential beginning of a new trend. They enter positions in the direction of the breakout, anticipating continued momentum.
Conclusion:
Technical analysis is a valuable tool for traders and investors seeking to understand market dynamics and make informed trading decisions. While it is not without its limitations and critics, many market participants find technical analysis to be a useful complement to fundamental analysis and other forms of market analysis. By mastering the principles, tools, and strategies of technical analysis, traders can gain a deeper insight into market behavior and improve their chances of success in the financial markets.


